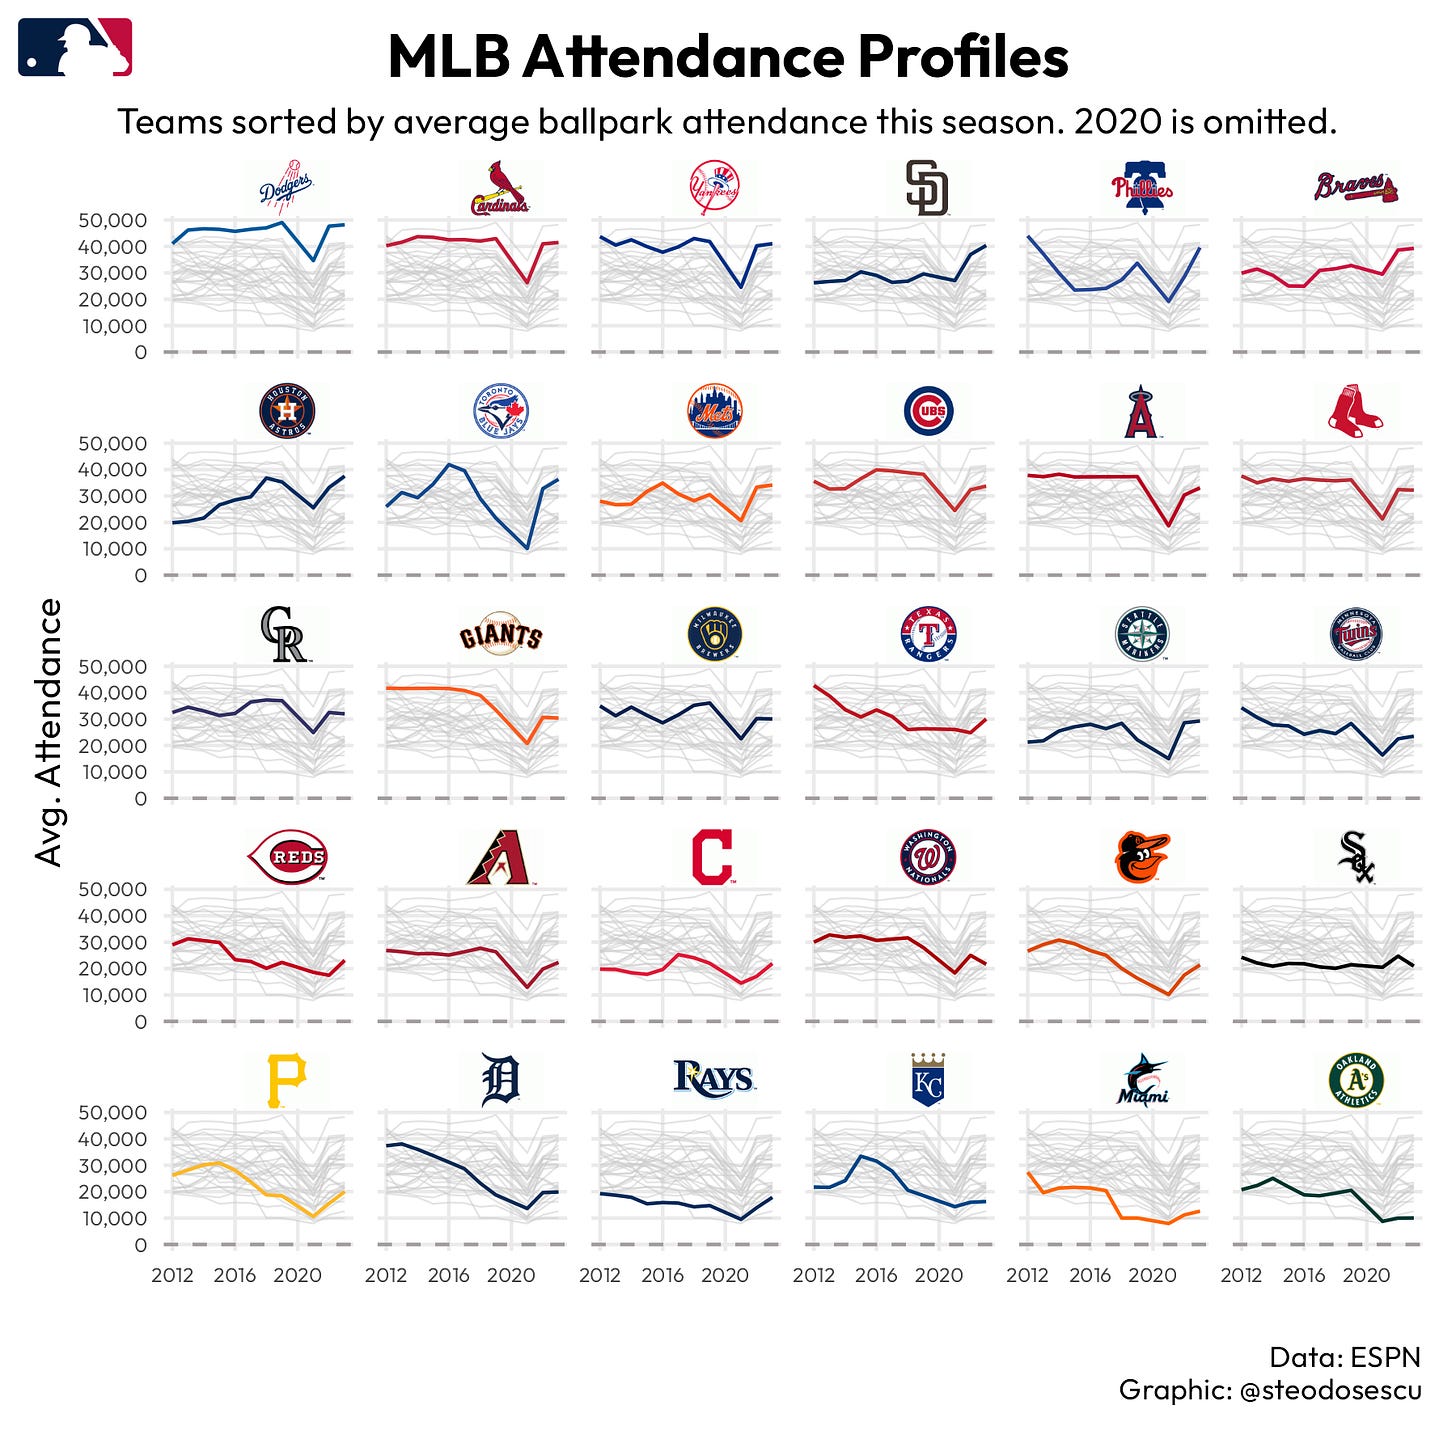
MLB attendance is up for the first time in nearly a decade
Teams with recognizable names and big ballparks have the largest average home attendance figures in Major League Baseball
Baseball has always been considered America’s pastime, but with interest in the sport flagging in the past decade or so, MLB commissioner Rob Manfred decided to institute the most drastic rule changes in recent memory this past offseason to spur interest in the sport.
With more than half a season in the books we can now assess how MLB’s recent rules changes have affected the game from fans’ perspectives. The most well documented change was the introduction of a pitch clock to quicken the pace of the game1. Other changes included a limit on the number of pickoff attempts allowed by the pitcher, a ban against defensive shifts and the institution of larger bases aimed at increasing action on the base paths.
While we can’t say these modifications directly correlate to increased attendance figures alone, we know things are trending in the right direction for Manfred and the league.
The average game is finishing more than 30 minutes quicker than it did in 2022, and on top of that, more action has been packed into the shorter games. Stolen base attempts have increased to nearly two per game thus far in 2023, and successful steals are the highest in league history. In addition, Batting Average on Balls in Play (BABIP) is currently up seven percentage points compared to 2022, all pointing to more fun for fans watching in the stands and on TV.
And it means after nine consecutive years of ballpark attendance declines, 2023 is finally on the way to breaking that trend.
According to MLB, 23 of the 30 clubs are registering increases in attendance this season. 2022, which was the first full year in which fans were able to come out to the ballpark in full force after the pandemic, saw a 6 % decline compared to 2019. But that trend is reversing more than halfway into 2023 — as of the All Star break attendance is up ~8% (28,000 vs. 26,000) on a per-game basis compared to last year. And 12 teams are seeing attendance up over 10% vs. last season at this time.
Big market, big stadium teams such as the Dodgers2, Cardinals and Yankees are leading the way averaging more than 41,000 fans per home game. The San Diego Padres are in fourth averaging more than 40,000 per game, which represents a 37 percent increase for them since before the pandemic.
On a year-on-year (YoY) basis the biggest gainers are the Philadelphia Phillies who saw an average of more than 11,000 more per game at the break. They’re followed by the Cleveland Guardians (+6,500 per game YoY), Toronto Blue Jays (+5,300 per game) and Texas Rangers (+5,000 per game).
One obvious outlier in this feel-good attendance story is the Oakland Athletics; the A’s announced they would likely be leaving Oakland for Las Vegas in the coming years. On top of having the league’s worst stadium, there’s bad blood between the franchise’s ownership and its fans so Oakland’s faithful is understandably not coming out to watch baseball games at the Coliseum this season. The A’s are averaging a league-worst 10,000 fans per game.
MLB is the second most attended men’s professional league behind the NFL in North America, which is no surprise given baseball and football are the two sports often played in outdoor stadiums which have larger capacities than their indoor counterparts in the NBA and NHL. Those other leagues are experiencing in person attendance booms as well. The NBA, for example, broke its attendance record this season averaging more than 18,000 per game for the first time ever.
But while baseball may be America’s pastime nobody can touch the NFL’s popularity. That league averages nearly 70,000 fans per game led by the Dallas Cowboys’ 93,000 per contest at AT&T Stadium3.
Pitchers now have 15 seconds for their delivery and 20 seconds if there’s a runner on base. Also, batters must be in the batter’s box ready to hit with at least eight seconds left on the pitch clock.
The Dodgers have a built in advantage in that they play in MLB’s largest stadium. Nevertheless the team’s play on the field has undoubtedly contributed to a league-best 48,000+ fans per game in Los Angeles.
Code to recreate the above plots in R can be found on my Github. Inspiration for the NFL is King plot came from a graphic in FiveThirtyEight’s story earlier this year on how big the NFL is compared to the other sports.


