Complete Guide to Super Bowl Squares: LVII Edition
I analyzed all the potential combinations and possible payouts so you don't have to
The Super Bowl is upon us and that means guacamole consumption is about to go through the roof, commercials will be just as closely watched as first down replays and people’s moods will hinge on whether Rihanna plays Umbrella they win America’s favorite prop game: Super Bowl squares1.
This year Between the Pipes is back with updated calculations on the relative probability of winning your party’s squares game using data from the past eight seasons2 of NFL football.
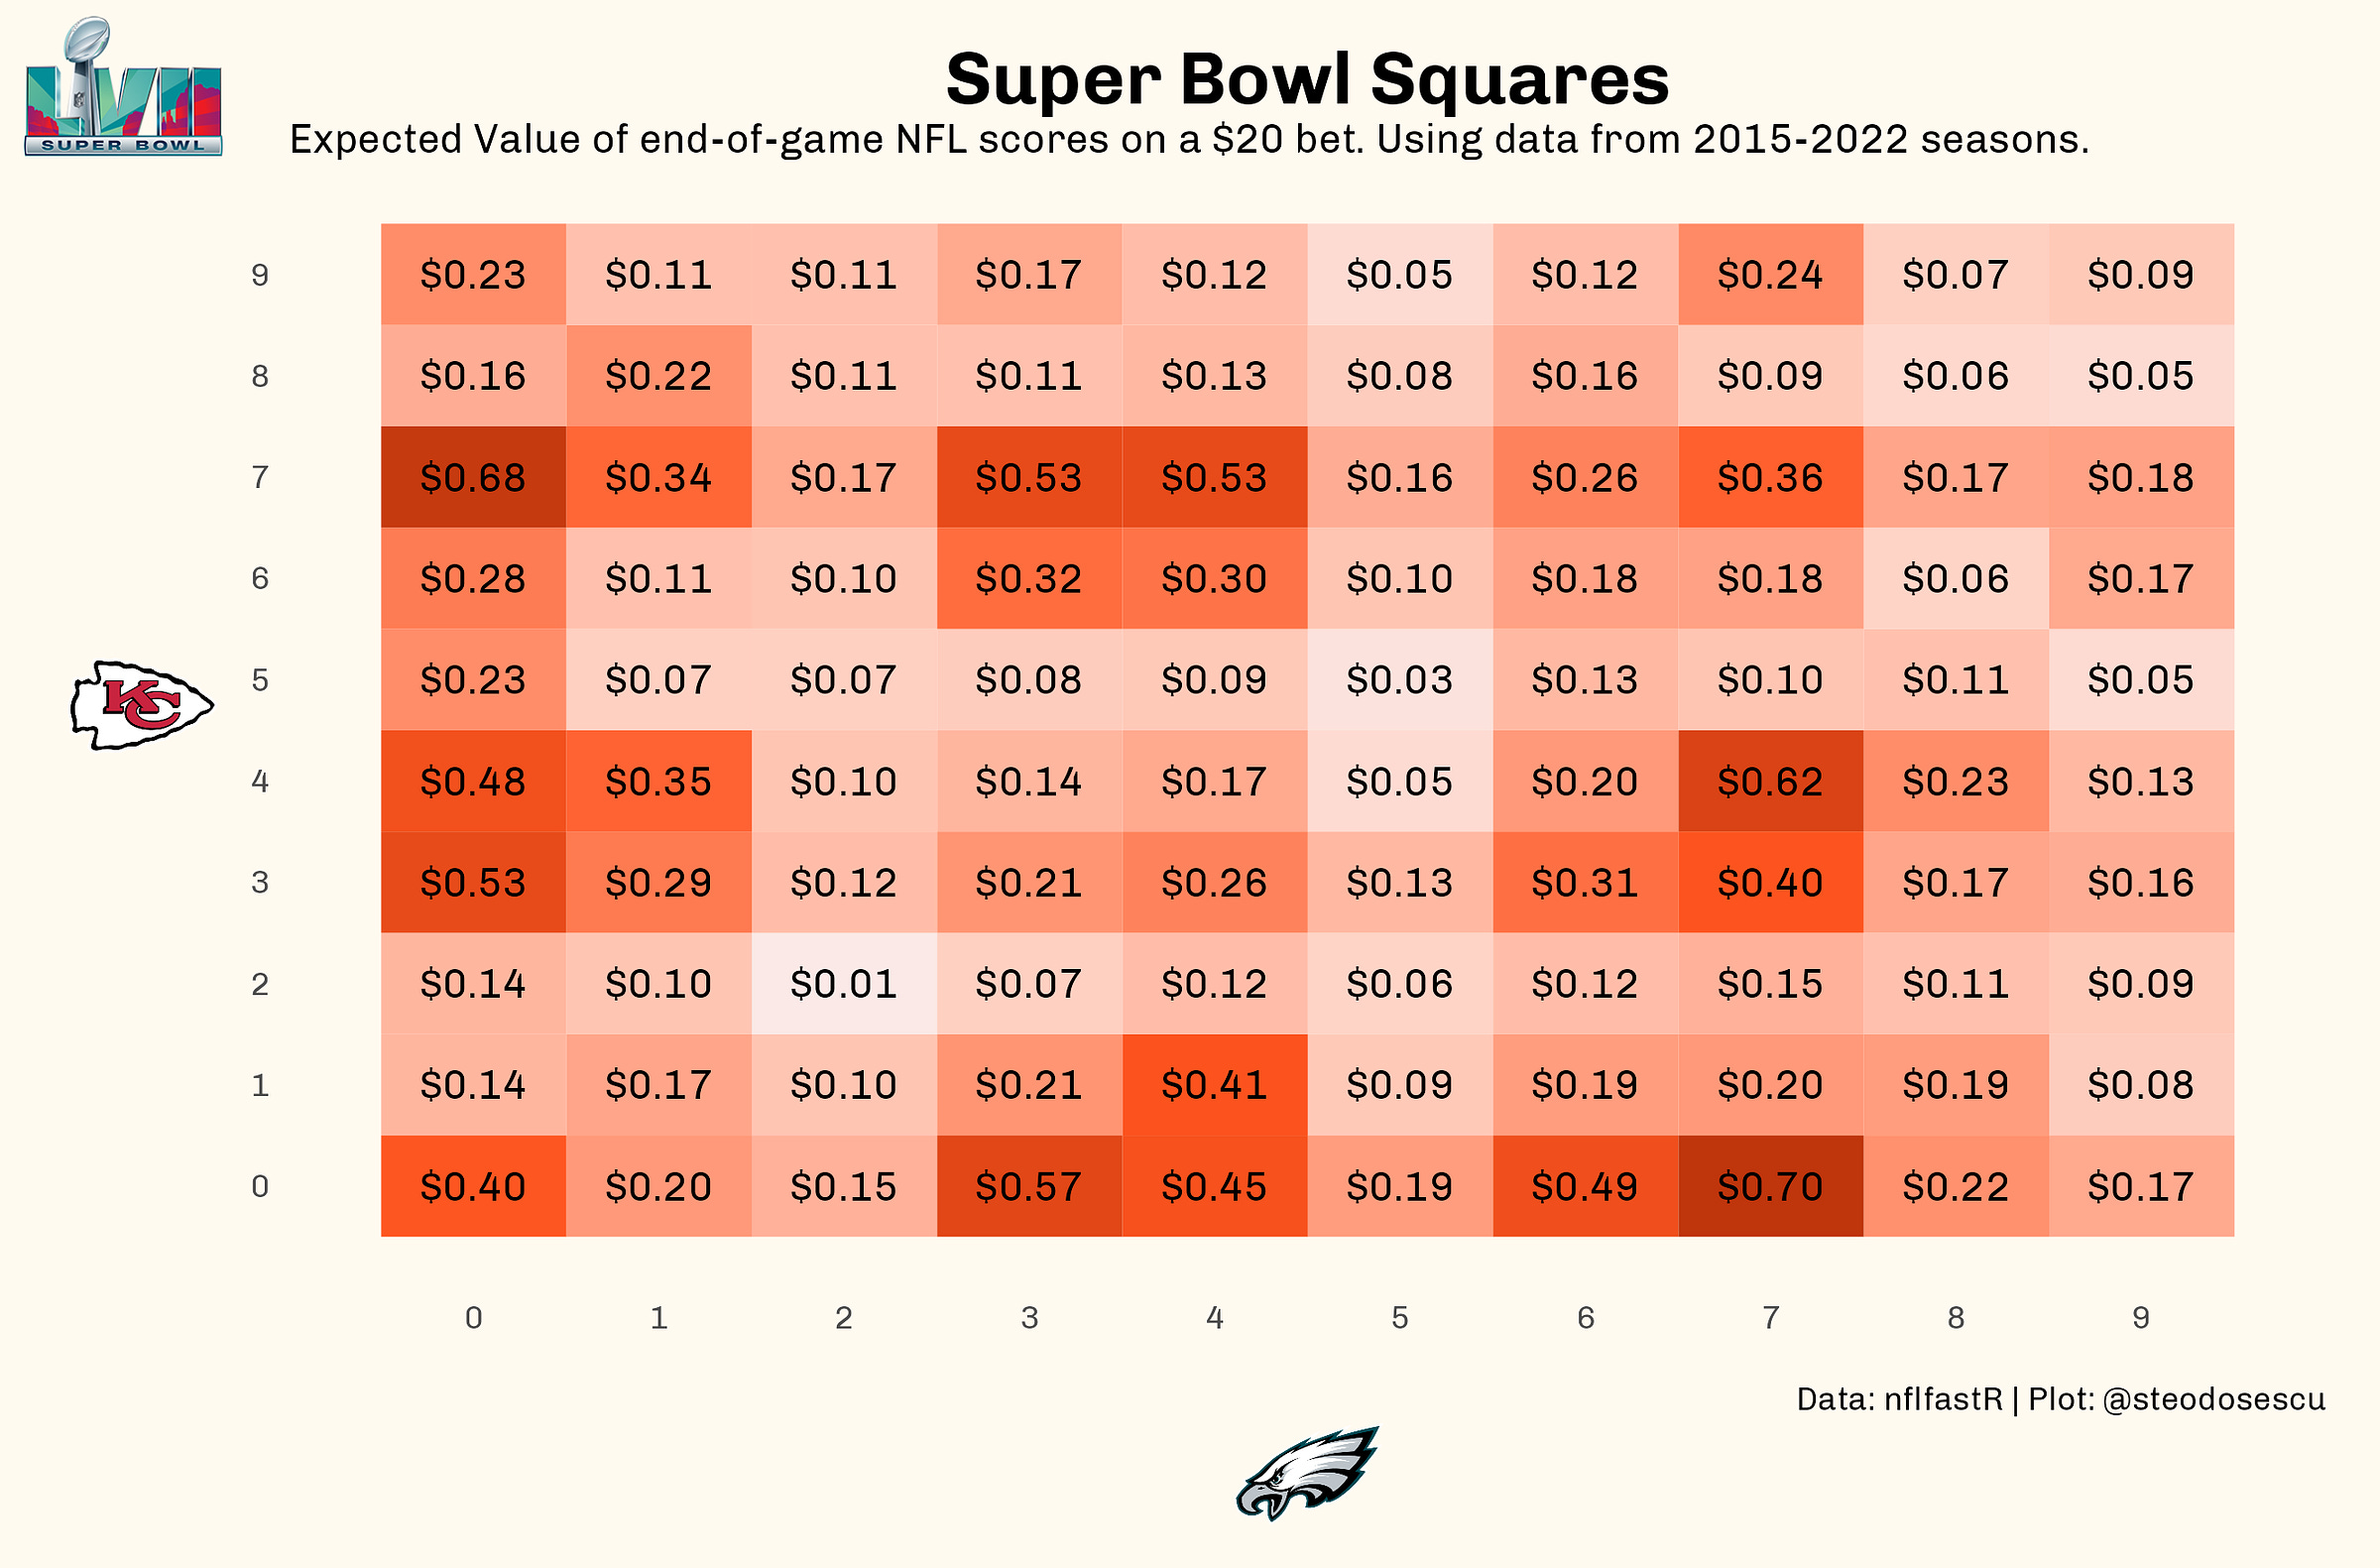
Looking at the above graphic we see that sevens and zeroes are the most desirable numbers to own for end-of-game payouts. An Eagles win (the designated home team) with their score ending in a seven and the Chiefs (away) with a zero is the most common scenario to expect at the end of the game on Sunday, one that has happened in 3.5 percent of games since 2015. The vice versa scenario — the “away” Chiefs ending in a seven and the “home” Eagles a zero — has occurred 3.4 percent of time.
Squares to avoid if you can help it are ones with a two or five. The dreaded 2-2 combination has happened less than 0.1 percent of the time, and 5-5 just 0.1 percent on the dot.
The concept of expected value says if you were to bet $20 per square you'd expect to get paid out in the following amounts given the those probabilities.
As I said above sevens and zeroes are the most desirable digits because scores ending in those numbers are the most common. In fact they’ve occurred more than 600 times since 2015. No other number can boast a frequency more than 500.
While the goal is to get the square with the correct end-of-game digits, many common iterations of the party game pay out at the end of each quarter too. So let’s look at the quarter-by-quarter probabilities and payouts.
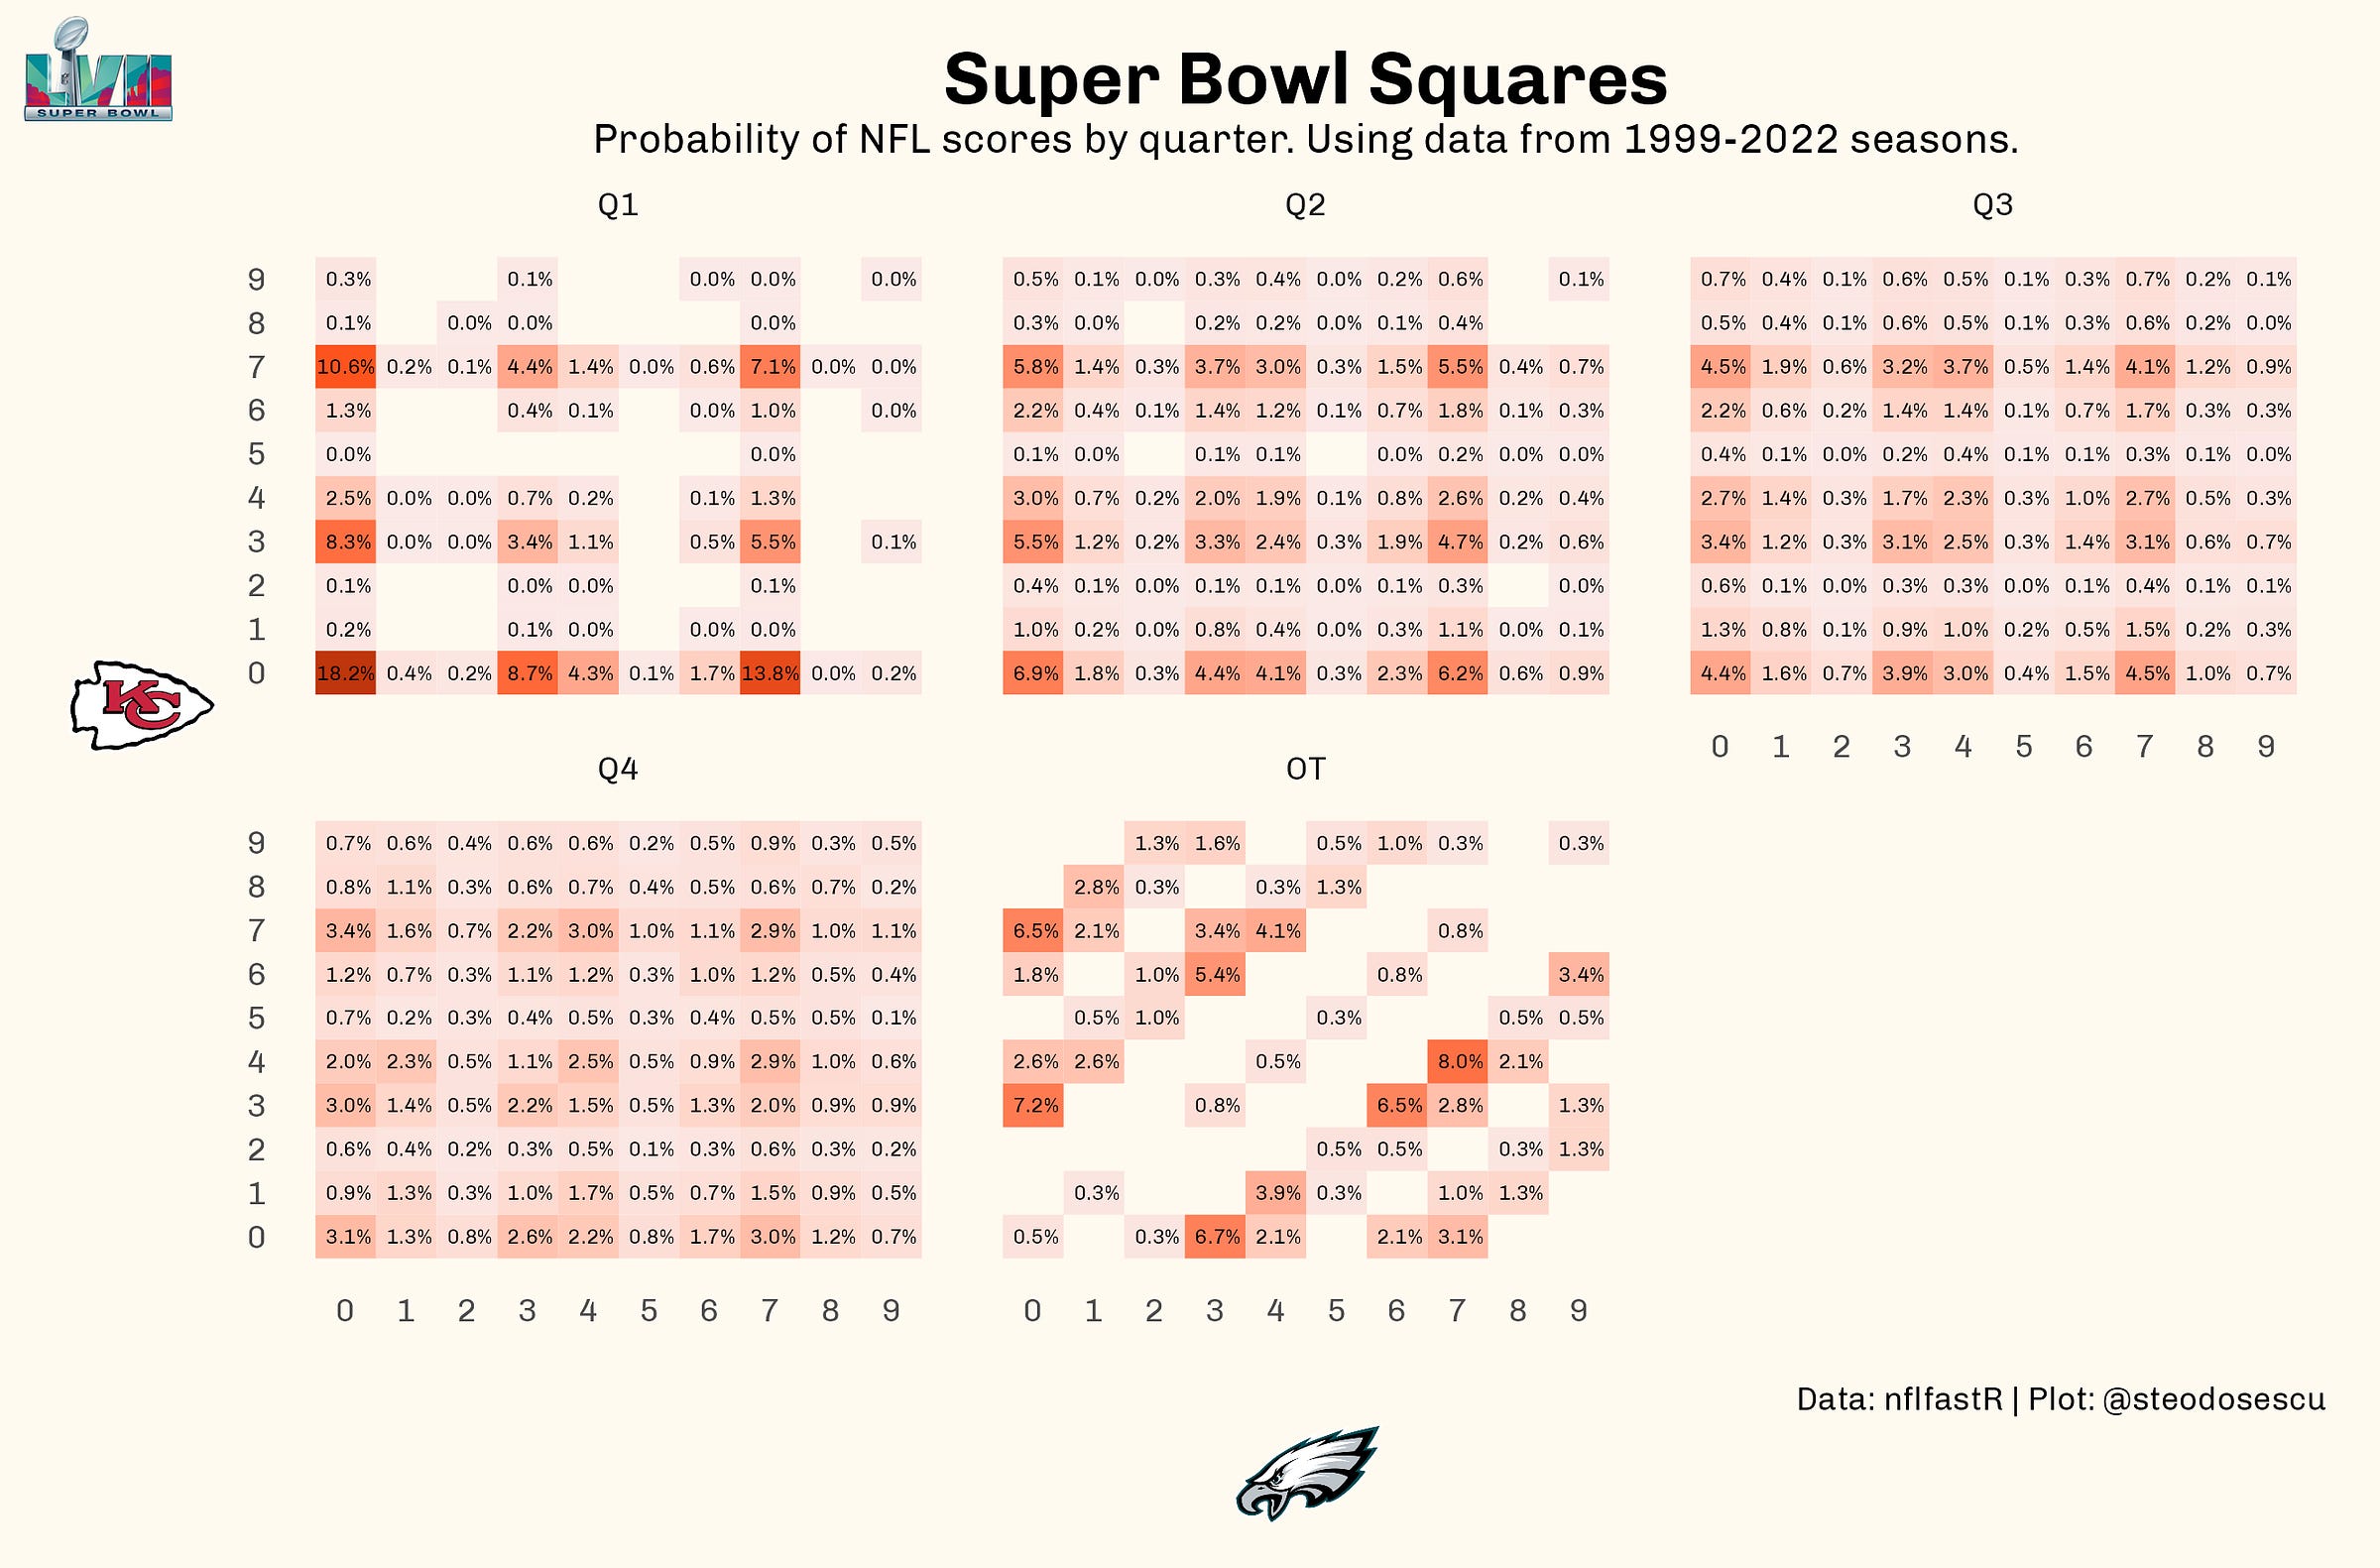
Here’s the expected value for each quarter; 0-0 looks really promising because of its frequency of happening in the early quarters — 18 percent to be exact for the first quarter3. According to an analysis done by Sports Illustrated years ago, 0-0 has won at the end of the first more than 20 percent of the time in Super Bowls since 2000. In all games between AFC and NFC teams it was about 19 percent during that timeframe.
The frequency of each digit at the end of every quarter and overtime looks like this:
Zero is common at the end of the first quarter because we don’t usually see a lot of scoring in the opening period of the Big Game. The reason why isn’t fully clear — perhaps teams are tentative to make a game-altering mistake in the early going, or the hype around the biggest sporting event of the year has teams playing conservative before settling into a rhythm. Whatever the reason it’s the most common digit at the end of any quarter, overtime included. Meanwhile some numbers like two and five have so rarely happened in the first quarter you can’t see them in the histograms above.
Bottom line, the top-10 best squares to own are various combinations of sevens, zeroes, threes, and in a couple cases, fours as well. Below you can see the cumulative chance of winning money for the most popular combos in a per-quarter payout system4.
Like I pointed out last year if the world of NFL scoring combinations excites you, I highly encourage you to watch one of the best YouTube videos ever: an introduction to Scorigami by Jon Bois. I rewatch it before the Super Bowl every year.
And with that, I wish you good luck tomorrow! You’re gonna need it.
The goal is to match the last digit of each team’s score at the end of each quarter and end of the game. For example, if the 1st quarter ends Chiefs 14, Eagles 7, the individual who bought the square intersecting Chiefs-4 and Eagles-7 will win money. The most common payout is one winner for each of the first 3 quarters and a 4th winner for the final score. The payouts can be equal or they can increase each quarter. For example, if each square is sold for $10, then each winner would receive $250 in the equal payout scenario. Alternatively the payout structure could look like: 1st Quarter $100; 2nd Quarter $175; 3rd Quarter $275; Final Score $450.
In 2015 the NFL moved the distance for the point after kick to the 15-yard line so I am limiting the analysis to this timeframe.
Note I used data back to 1999 for this portion of the analysis since the sample size of certain less-observed combinations otherwise gets too small on a per-quarter basis.


