


Charting early season MLB performances
Visualizing stats and trends that stand out early in 2025

We’re nearly one month in to the 2025 MLB season which means we’ve completed about 15 percent of this year’s campaign. It’s early but a few interesting trends and storylines have started to catch my eye.
If you want to follow along I will be tracking all of the stats and corresponding graphics you see below throughout the season at my new website1 (click below) dedicated to MLB analysis.
Note: I recommend you check this post out in your browser rather than in your email client because the charts look better on the web.
Who’s Hot, Who’s Not?
It was well documented the Dodgers — the 2024 World Series champions — were the heavy preseason favorites headed into 2025. It should be no surprise Los Angeles is several games above .500 at this point, but what is a surprise is the fact the Dodgers have spent the past couple weeks flirting with third place in their own division.
One stat I like to look at popularized by the sabermetric movement is Pythagorean wins, which is meant to help tease out how teams have performed versus their underlying run scoring numbers. The concept, conceived by Bill James, strives to “determine the number of games that a team should have won — based its total number of runs scored versus its number of runs allowed,” according to MLB’s website.
Using pythagorean wins the Dodgers have not actually impressed as much as pundits thought they would, nor as much as their overall record suggests. As of Tuesday, they had a run differential of +9 runs, 10th-best in the league, which is dragging down their expected Pythagorean win total.
I fully expect LA to recover from this given most of that run differential damage was done in a single game where they suffered the worst home shutout loss in Dodger Stadium history when the Cubs drudged them 16-0 a couple weekends ago.

By the same token the Cubs have the best run differential in the league (+41 runs) thanks to that offensive onslaught in Chavez Ravine. Chicago got swept in a two-game series played in Japan against the same Dodgers team to kick off the regular season in March, but has since bounced back and now leads the NL Central with a 16-10 record. The Cubs may be even better than their record suggests as well.
The San Diego Padres (17-7), New York Mets (17-7), New York Yankees (14-10), Detroit Tigers (14-10) and Arizona Diamondbacks (14-9) are all impressing in the early going as well, as their underlying run scoring profiles would suggest they’re better than their actual records.
Another way we can look at how teams have been playing relative to expectations is by comparing actual win percentage to preseason predictions for all 30 teams. Looking at a composite of several statistical models and Vegas over/under odds on how many games each team would win this season, the Padres, Mets, and San Francisco Giants, stand out above the rest. San Diego is tied for the best team in baseball with the red-hot Mets at the moment and is currently about .250 points better than models and experts expected the Padres to be this year.
For their part the Giants — whose performance is notoriously difficult to prognosticate — won their first ever series at Yankee Stadium earlier this year and are a game back of the Padres for the division lead at 16-9. With all that firepower early in the season the NL West is tracking to have four teams make the postseason at the moment.

On the other end of the spectrum is a trio of teams — the Minnesota Twins, Atlanta Braves, and Colorado Rockies — that are performing even worse than expected compared to the Chicago White Sox, a team that was in the running for worst team in baseball history last season. To add insult to its 0-7 start for Atlanta, which was expected to contend for the playoffs, newly acquired 3B Jurickson Profar was handed down a season long suspension for PED violations during the first month of the season.
The Rockies, meanwhile, have the unfortunate luck of being in the same division as the aforementioned Padres, Dodgers, Giants, and D-Backs.
Runs Galore
The Cubs have done their damage at the plate in the early going. They lead the league in runs scored, averaging 6.2 per game as of Tuesday, followed closely by the D-Backs and Yankees; both teams have run differentials above +20.
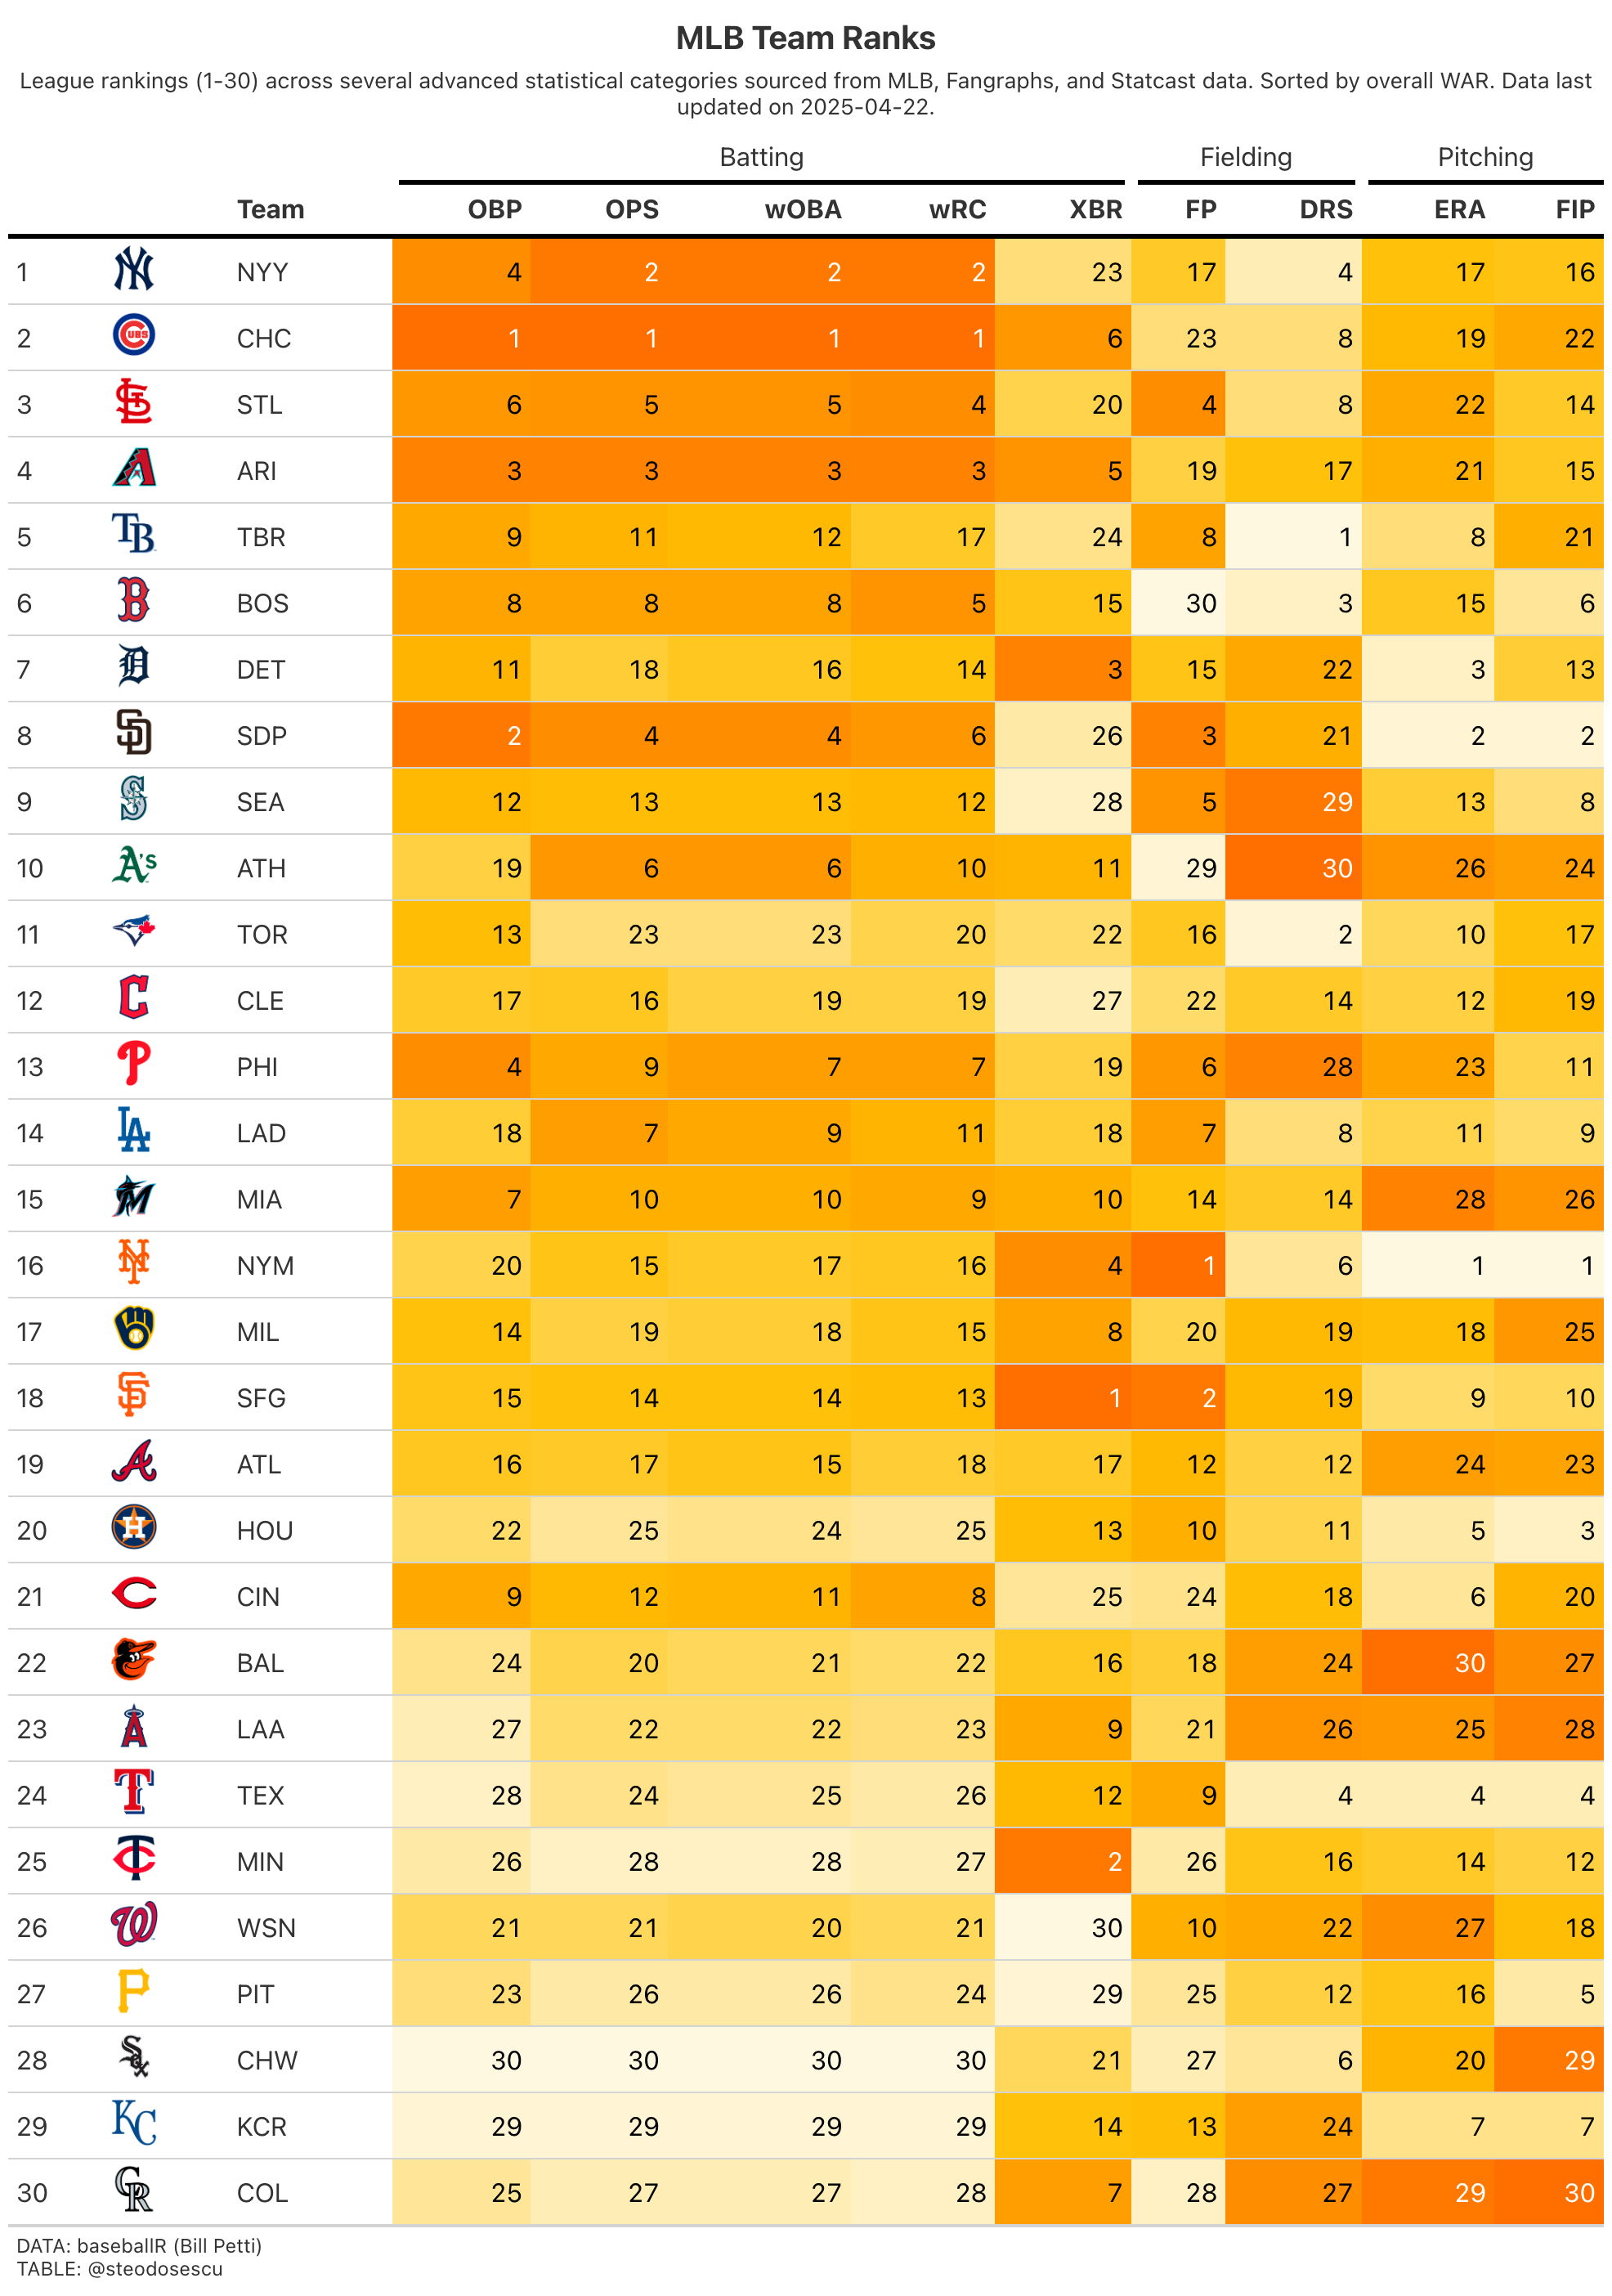
The Cubs are also tops in the league in other hitting categories like wOBA and OBP2. That combined with a disciplined approach at the plate has led them to the best batting WAR in the league, according to FanGraphs.
For the Yankees their use of the “torpedo bat” garnered attention of the headlines during opening weekend a few weeks ago. Engineered by a former MIT physicist to put more wood in the part of the barrel a player tends to make contact with, the Yanks’ offense is now sporting MLB’s second-best batting marks behind the Cubs.

On the mound, the Padres and Mets are getting it done with both stellar starting and relief pitching as they have the lowest ERA and FIP3 through the first 20-plus games.

Overall Ranks
Attendance
Another metric I like to track is average attendance. Despite a relatively underwhelming start to the season for the defending champion Dodgers, they once again lead the league in attendance this season. This, of course, is by virtue of them having the largest capacity stadium in the league at 55,000.
The Angels, Padres, Phillies and Yankees are all averaging more than 40,000 fans per game as well. Teams hailing from colder weather environs this time of year like the midwest are predictably on the lower end of this list.
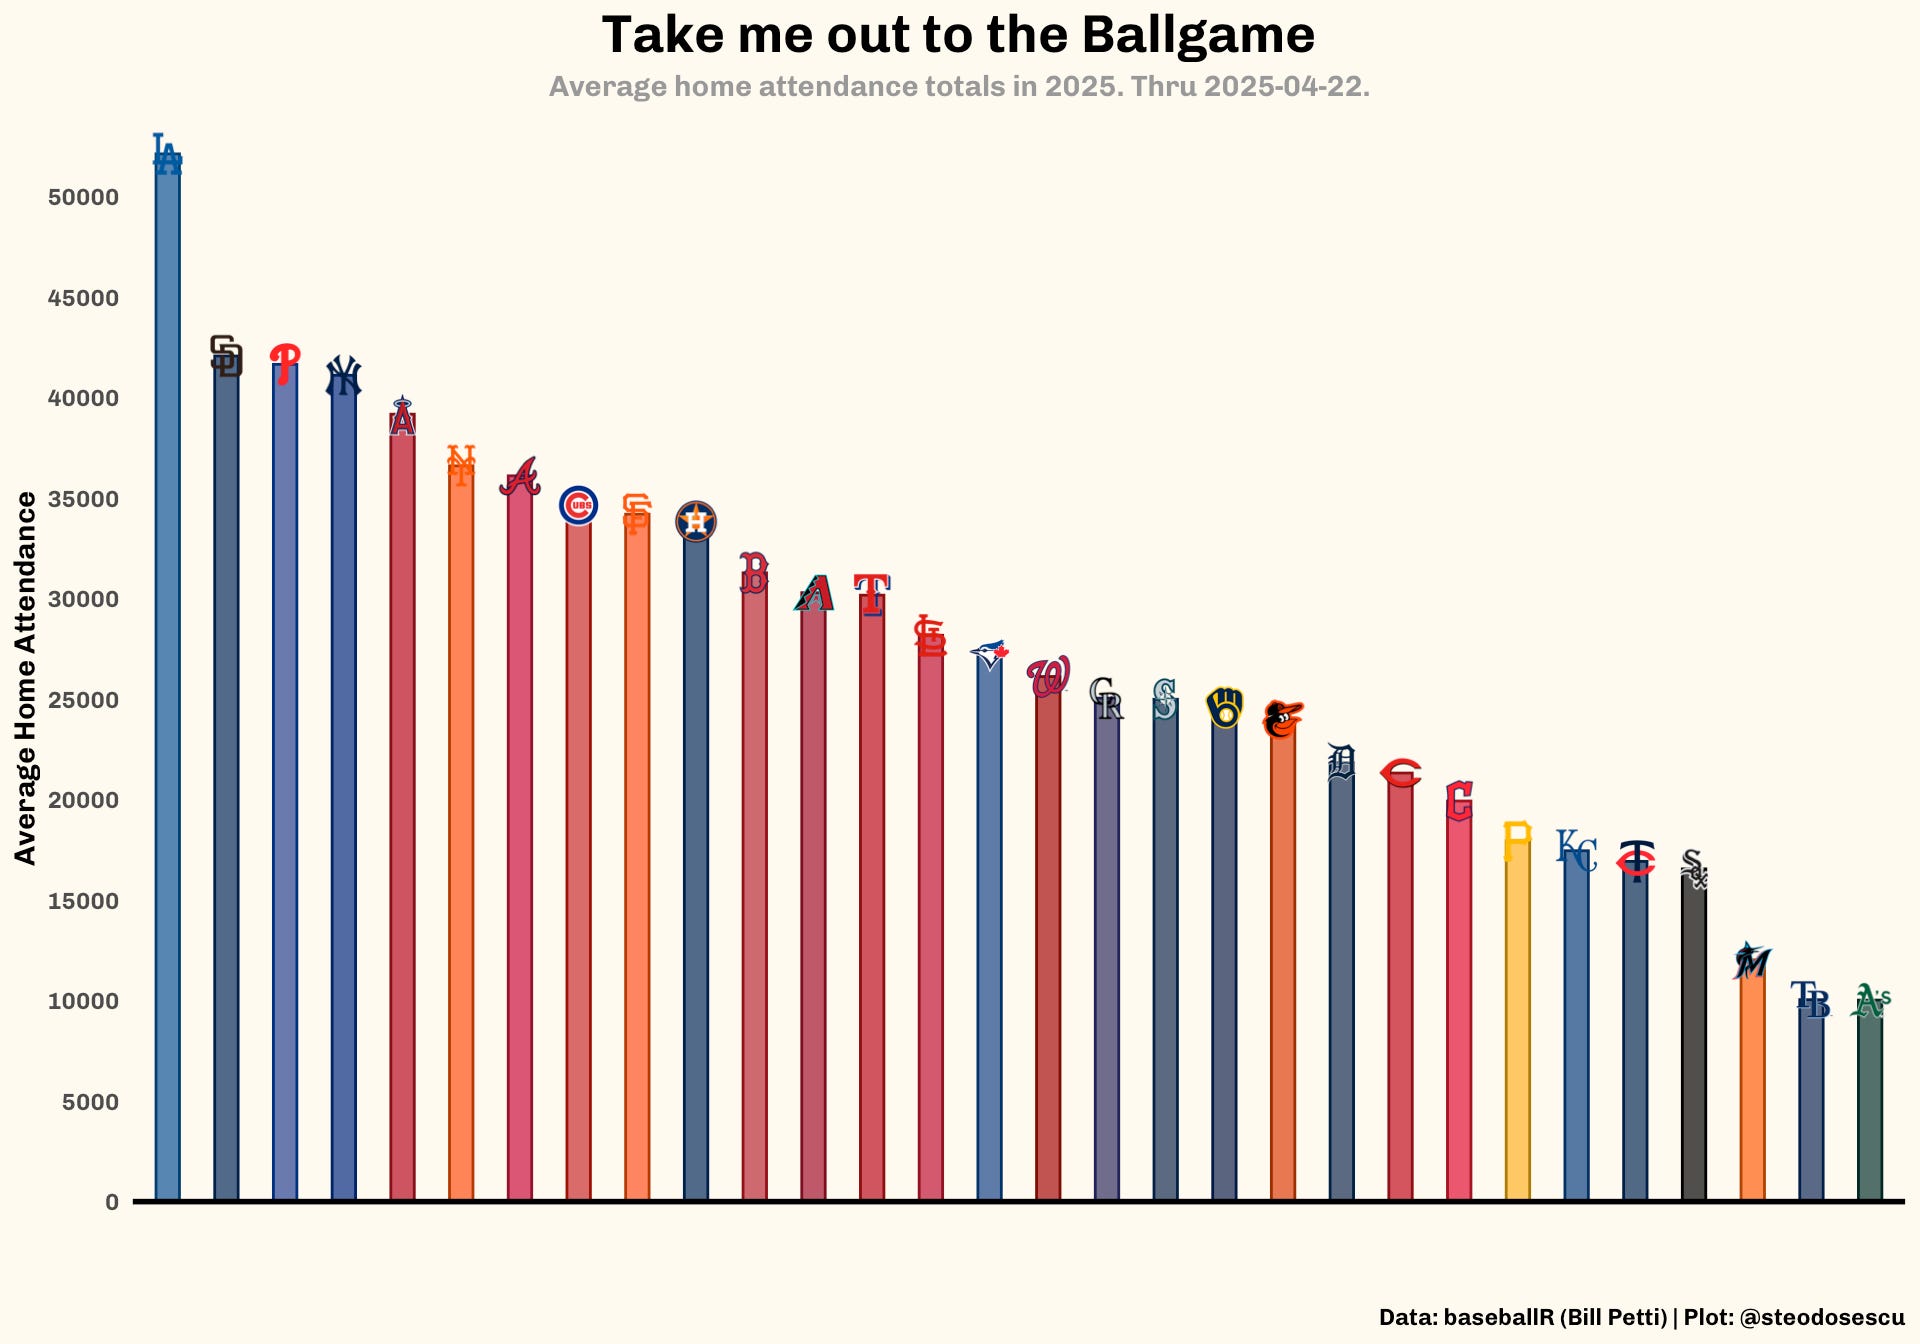
While the Miami Marlins have a difficult time drawing fans in good times and bad, it’s the A’s and Tampa Bay Rays that are bringing up the rear this year. Both teams are spending the 2025 season playing in minor league ballparks about one-third the size of a standard Major League Baseball stadium.
More of a poor man’s Baseball Savant, complete with stats and insights from FanGraphs and Baseball Reference. I’m trying to think of a better name.
wOBA: Weighted on-base average is a version of on-base percentage (OBP) that accounts for how a player reached base -- instead of simply considering whether a player reached base. The value for each method of reaching base is determined by how much that event is worth in relation to projected runs scored (example: a double is worth more than a single).
According to MLB, Fielding Independent Pitching (FIP) is similar to ERA, but it focuses solely on the events a pitcher has the most control over – strikeouts, walks, hit-by-pitches and home runs. It entirely removes results on balls hit into the field of play.