Introducing my new NFL Win Probability app
By: Stephan Teodosescu
The data available to those sitting at the intersection of NFL fandom and stats nerdom keeps getting better. For the R-heads like me the development of the nflfastR package1, and the whole nflverse ecosystem in general for the R programming language, has been a game changer.
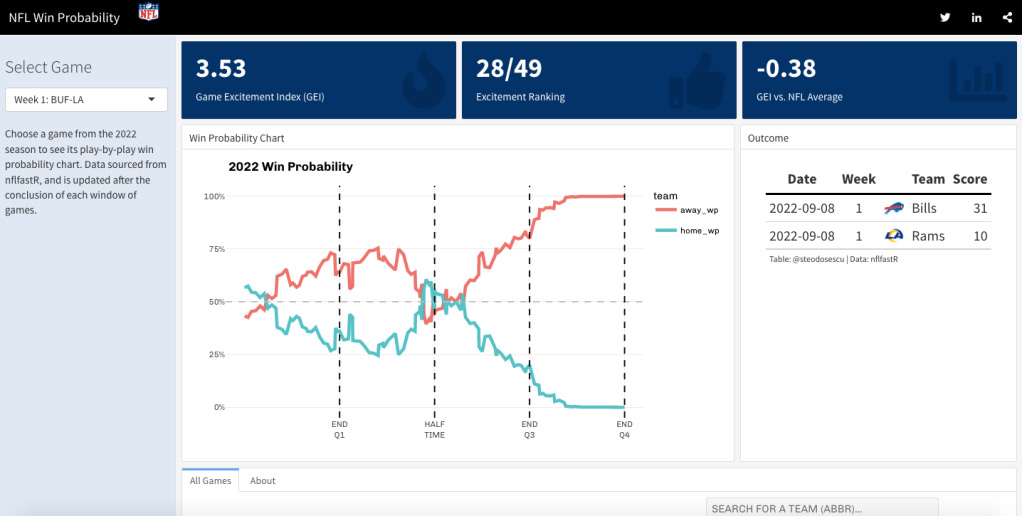
We nowadays have access to play-by-play data back to 1999 that can be efficiently gathered for any sort of analysis. Using these plethora of data I recently created an NFL Game Win Probability web app2, which allows you to look at the win probability graph and excitement index of any NFL matchup this season.
What is Win Probability?
Win Probability (WP) is an estimate of a team’s likelihood of winning the game at a point in time given the current situation at the start of that play. Win Probability Added (WPA) is the change in WP from one play to the next, highlighting that play's influence on the outcome of the game. If you graph these WP changes throughout the course of the game you will get a visual representation of how that game played out. The nflfastR model uses logistic regression to model likelihood of winning after each play based on the score, field position, home field advantage, distance to the first down, time remaining, etc.
Knowing the change in play-by-play win probabilities also gives us an opportunity to identify how exciting a given game was3. Leveraging work that Luke Benz has done for college basketball, I computed a Game Excitement Index (GEI) for every NFL game, which you can examine in the dashboard.
Quantifying excitement can be done by summing the absolute value of the win probability change from each play and multiplying by a normalized time parameter4. This gives an index by which we can rank each game’s excitement factor. The way to interpret, for example, a Game Excitement Index of 4.0 is that the win probability changed by a total of 400% over the course of that game. The higher the number, the more exciting the game.
I hope you enjoy exploring the dashboard as much as I did creating it.
For more NFL advanced stats content throughout this season check out my NFL Analytics website.
____________________________
nflfastR is a public repository of NFL play-by-play data and set of functions to efficiently scrape that data. It expands upon the features of nflscrapR and was created by Sebastian Carl and Ben Baldwin.
It was built with R using the Rmarkdown and flexdashboard frameworks. The code behind the tool is made available here.
Shoutout to Gambletron 2000, the OG of calculating the "hotness" of a game, as far as I know.
The formula is GEI=3600/t∑i=|pi−pi−1| where t is the length of the game (in seconds) and pi is the home team’s win probability on play i of the game. According to Benz, “One can think of GEI as a measure of the length of the win probability curve if it were to be unwound, normalized to the length of a standard regulation game.” The reason he chooses to normalize the length of games is to remove the effect of overtime games that are otherwise sloppy being considered as more exciting than others simply because they lasted longer (thus had more win probability swings).


